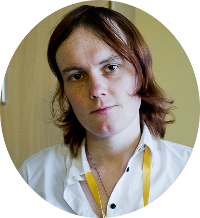
The results are all finally in! Of the 10 trans & non-binary candidates who stood, one – Anwen Muston – has been elected. This brings the total number of openly trans elected politicians to an all-time high of three, or approximately 1 in 6000 councillors in England. (There are none in Wales, Scotland or Northern Ireland that we know of)
Congratulations to Councillor Anwen Muston and commiserations to all those who were not successful this time. I hope I will be able to include many of in next years’ reporting!
Whilst the increasing number of candidates standing is good news and 1 in 6000 is close to the estimates for the trans population of England, trans people are far more likely to be politically active and a success rate of one in ten is, unfortunately, quite poor. This suggests that out, trans and non-binary candidates are still not being given winnable seats to fight in local elections. However, it is only since 2013 or 2014 that trans people have been standing in any significant numbers and few people are successful at their first attempt, so this will hopefully improve over time.
(Binary, or predominantly IDs as such) |
||
|---|---|---|
| Northern Ireland Assembly | ||
 |
Ellen Murray West Belfast party list, sole GPNI candidate 11th place on first preference votes: 0.9%, change: +0.9% [source] |
|
| London Assembly | ||
 |
Emily Brothers London-wide party list, 9th of 11 3 party list candidates elected: 39.9%, change: -1.2% | |
| Principal Local Authority | ||
 |
Anwen Muston Wolverhampton, East Park Ward Elected: 56.4%, change: +4.5% [source] |
|
 |
Helen Belcher Wokingham Borough Council, Evendons Ward 2nd place: 38.2%, change +17.8%. (1st Place: 43.2%) [source] |
|
 |
Jennifer Kirk Bolton City Council, Tonge with the Haulgh Ward 3rd place: 14.5%, change: -3.8% [source] |
|
 |
Jane Fae North Hertfordshire District Council, Letchworth East Ward 6th place: 6.6%, change +6.6% [source] |
|
 |
Aimee Challenor Coventry City Council, St Michael’s Ward 4th place: 5.5%, change -0.9% [source] |
|
| Scottish Parliament | |
|---|---|
 |
Anna Crow Glasgow party list, 9th of 9 1 of 9 elected: 9.4%, change: +3.5% [source] |
| Principal Local Authority | |
 |
Henry Foulds Amber Valley Borough Council, Alfreton Ward 4th place: 5.0%, change: +1.6% [source] |
 |
Maria Munir Watford Borough Council, Vicarage Ward 2nd place: ~13.7%, change ~-1.0% (Turnout figures for the all-up election have not yet been published, so this is an estimate)[source] |

1 comment